
SES adjust 3D TSD Geosteering Software
SES adjust 3D TSD Geosteering Software
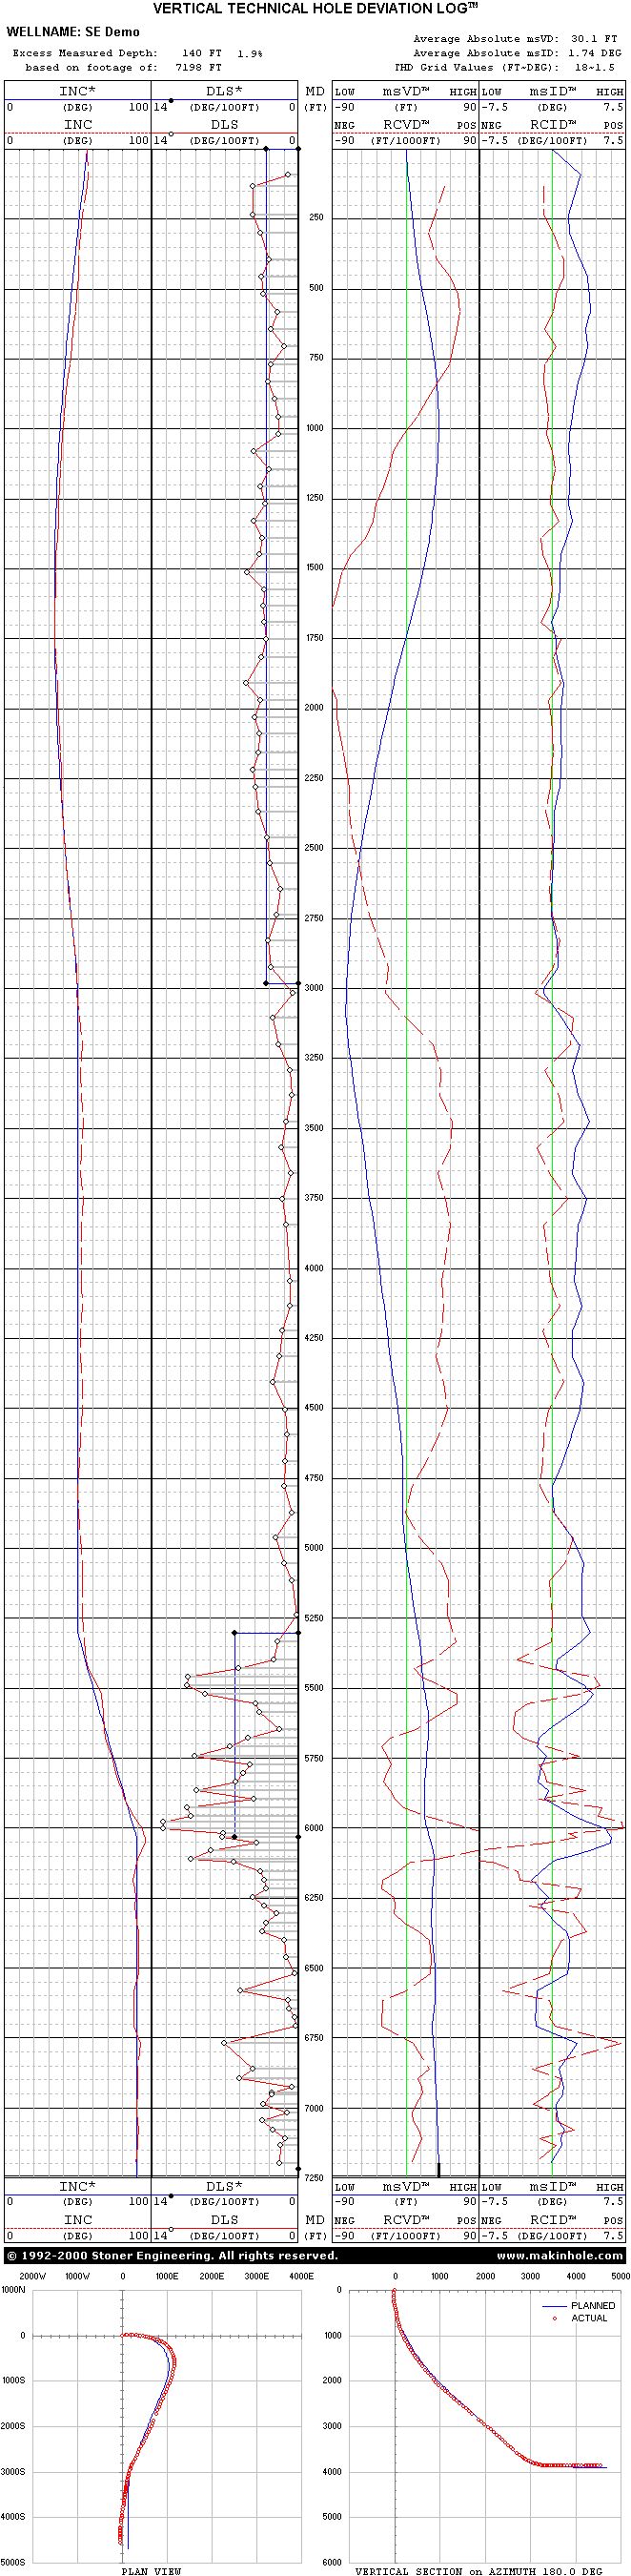
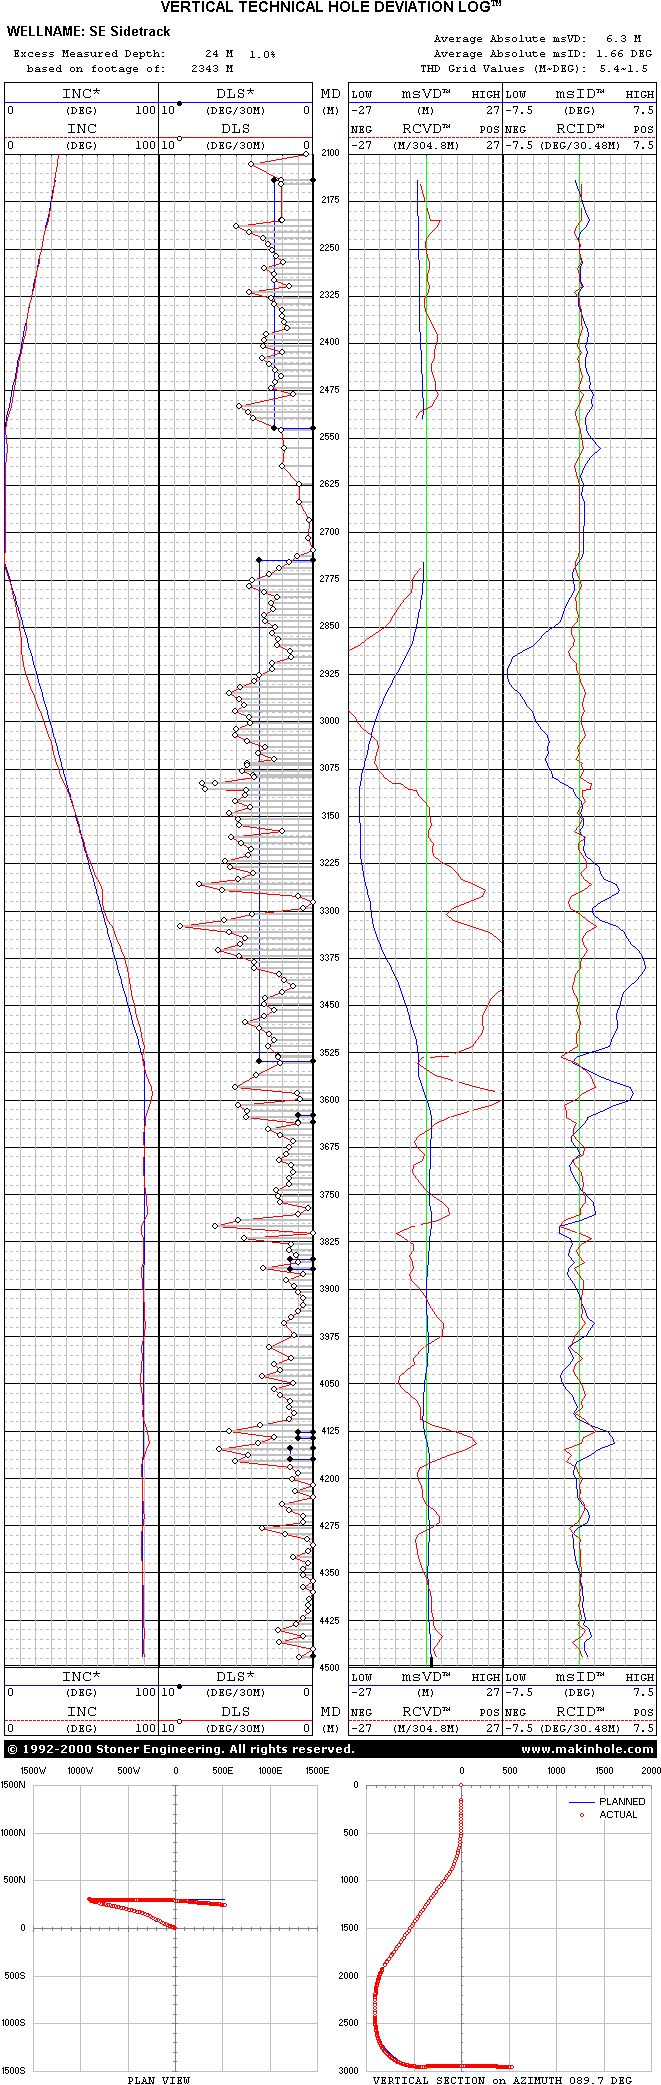
Technical Hole Deviation (THD) Well Logs graph geometric directional well plan and actual wellbore properties. They enable observers to monitor directional control performance and help directional drillers to rationalize directional control actions performed between survey stations.
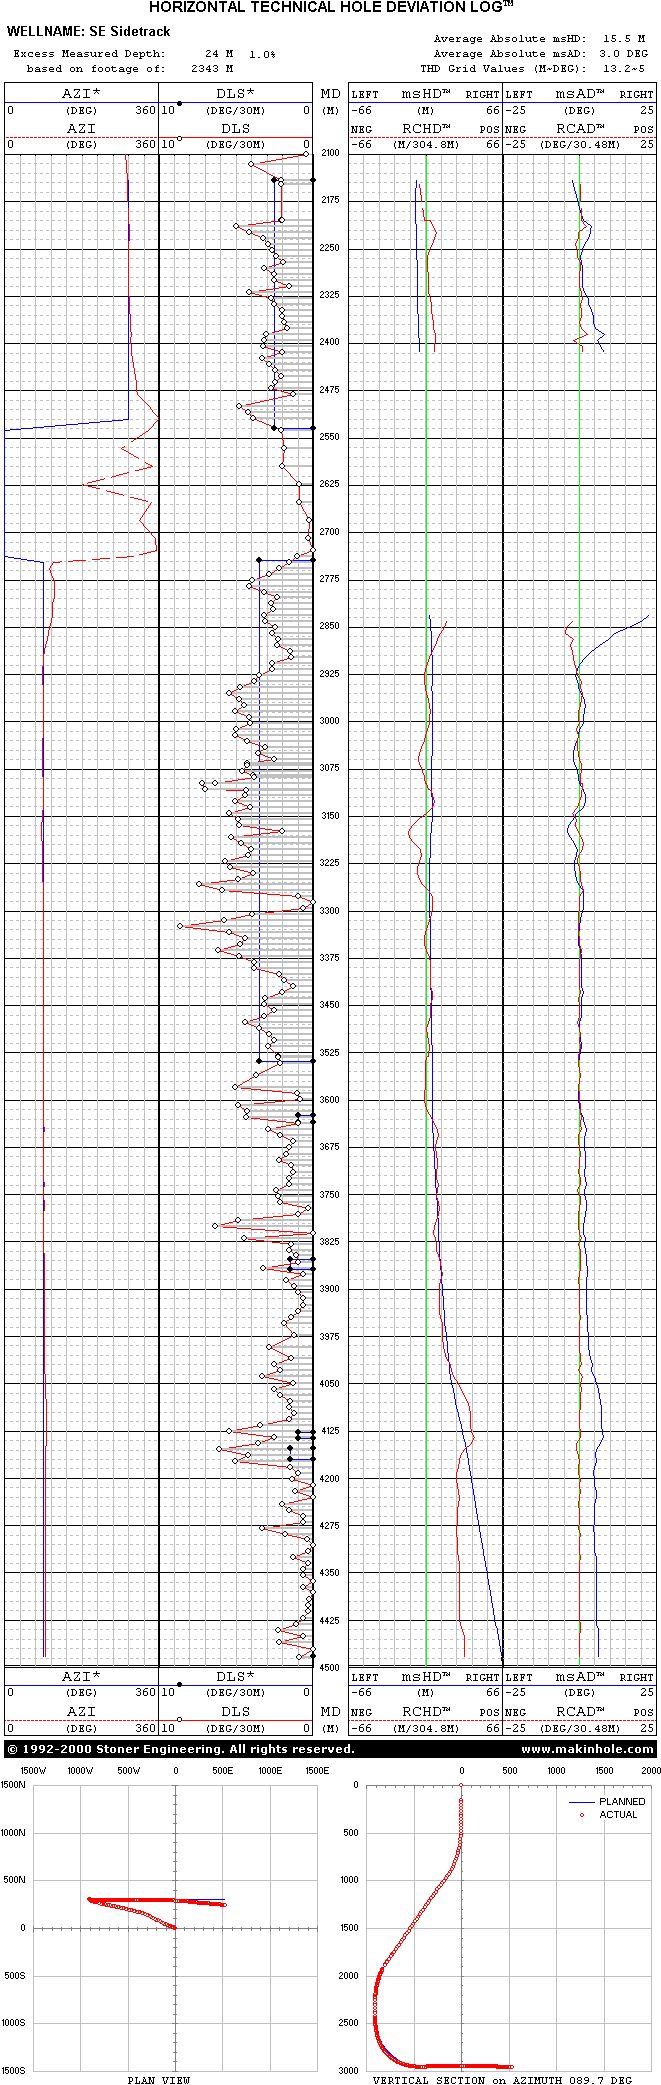
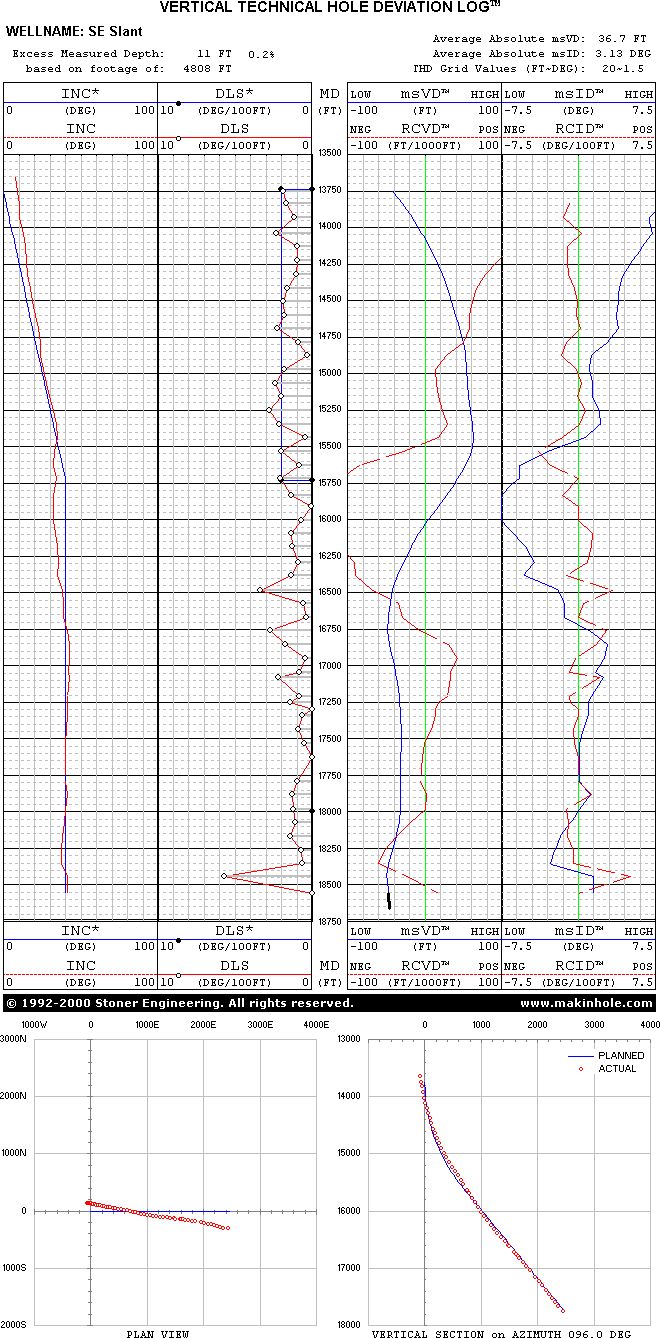
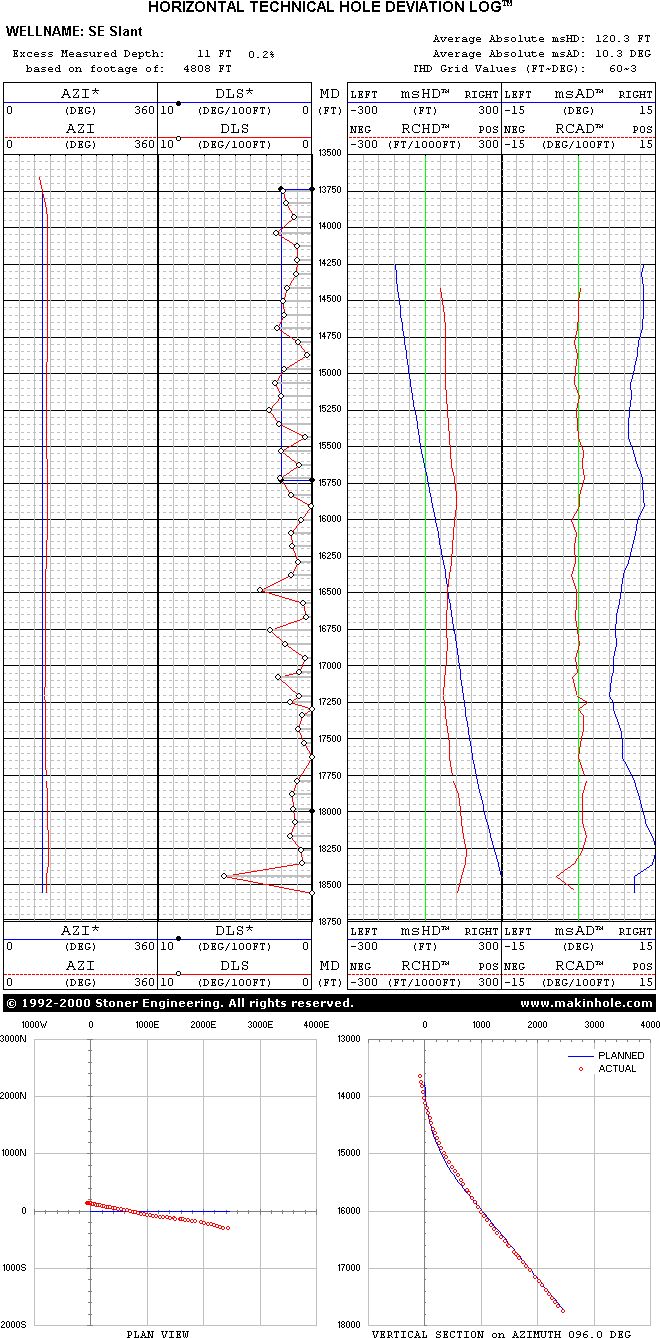
THD component values are plotted versus actual measured depth (MD). The Vertical THD Log addresses deviations in the "vertical" sense. It presents planned and actual values of wellbore inclination and dogleg-severity (DLS), and THD components VD, RCVD, ID, and RCID. Similarly, in the "horizontal" sense the Horizontal THD Log presents planned and actual values of wellbore azimuth and dogleg-severity, and THD components HD, RCHD, AD, and RCAD.
Regardless of the planned well path linear/curved 3D/2D complexity, the target path is always a single vertical green zero line on the THD track.
Like standard directional plots, THD logs can be created prior to drilling and present the plan. Then, as drilling commences, the "actual parts" of THD are plotted and directional control performance unfolds. The footer section of a THD log contains standard vertical section and plan view directional plots.
Planned and actual DLS are graphed on the inner left track of both the Vertical and the Horizontal THD Log. Depths with directional survey stations are marked with unfilled circles. Circular filled markers on the planned DLS curve convey critical-point well plan changes (e.g., curved to straight hole section).
The log header section contains the following analytics:
Excess Measured Depth - amount of actual hole drilled subtracted by the corresponding planned measured length of drill hole. This value may indicate the "cost" of oscillating about the planned path. However, in some cases this value can be negative such as when dropping a wellbore to vertical with actual DLS exceeding planned DLS.
Average Absolute VD - average absolute value of vertical deviation (VD) associated with real survey stations over the length of drill hole for which the THD log was created. A smaller value usually indicates better directional control performance.
Average Absolute ID - average absolute value of inclinational deviation (ID) associated with real survey stations over the length of drill hole for which the THD log was created. A smaller value usually indicates better directional control performance.
THD Grid Values - convey the grid values of the THD tracks as a result of auto-scaling. For the example header below, "20~2" means the grid value for the VD track is 20 feet and the grid value for the ID track is 2 degrees.
The outer left track graphs planned and actual wellbore inclination. Technical hole deviation in the "vertical" sense is displayed on the two right tracks. The inner right track displays vertical deviation (VD-blue) and the relative change in vertical deviation (RCVD-red). The outer right track displays inclinational deviation (ID-blue) and the relative change in inclinational deviation (RCID-red). A zero line (green) centers each of the two THD tracks. The actual wellbore was drilled "on depth" and "on inclination" only when VD, RCVD, ID, and RCID all trace their respective zero lines.
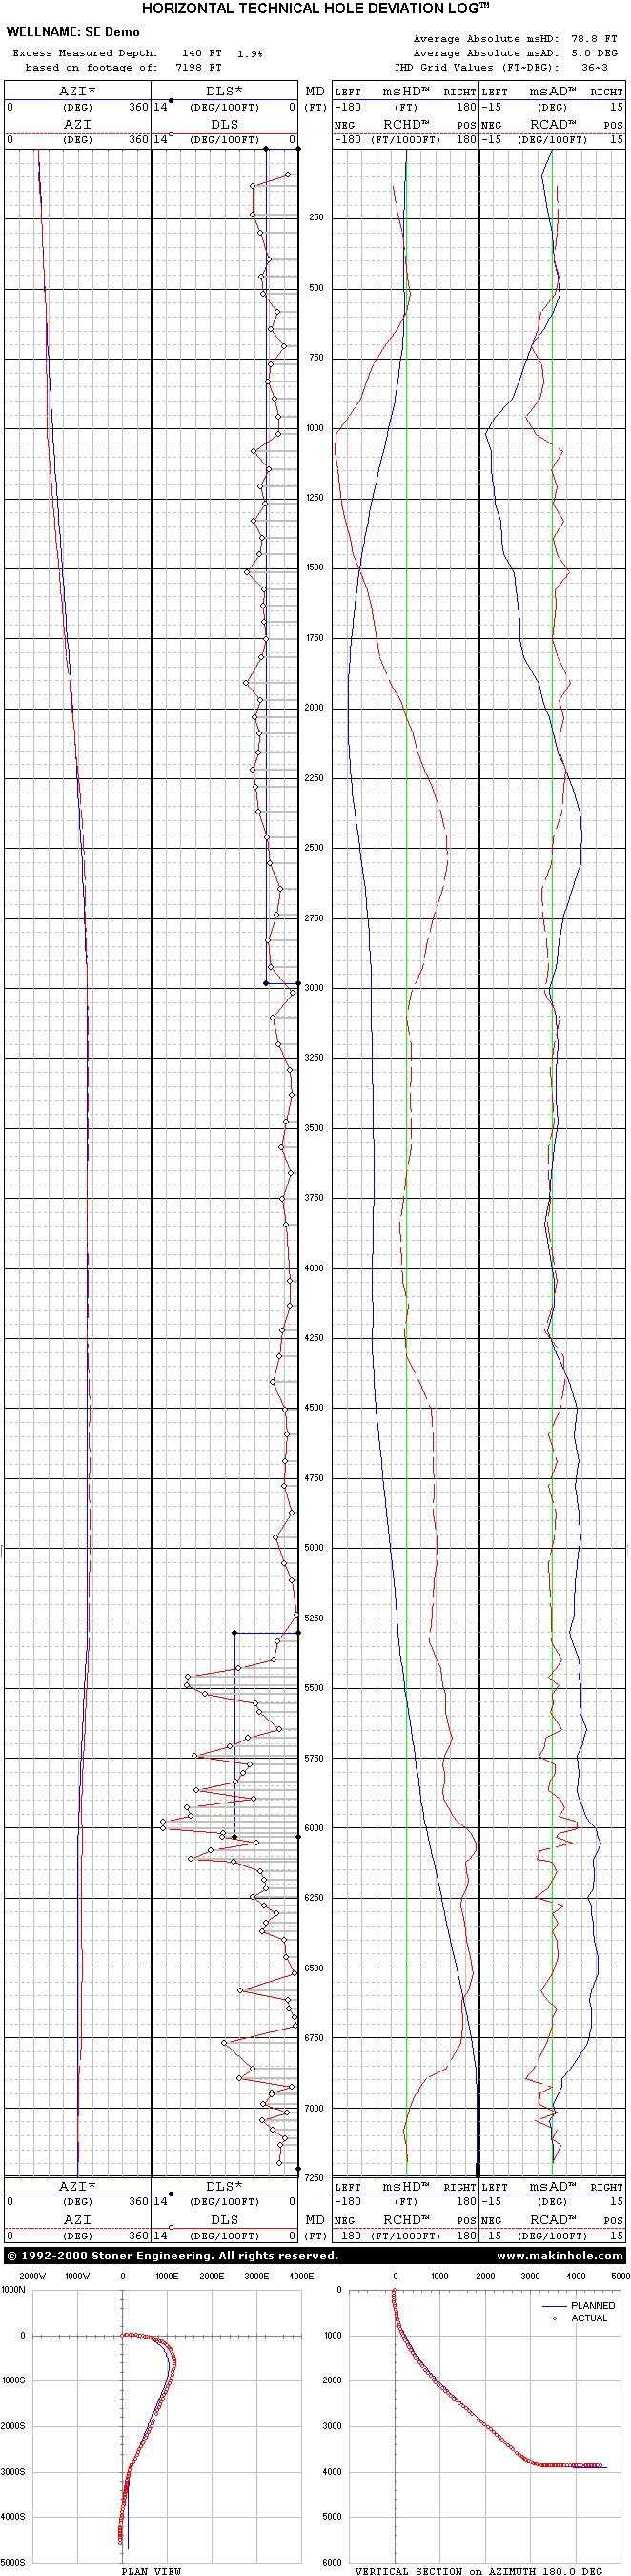
The Horizontal THD Log header section contains the same Excess Measured Depth values as detailed above and the following analytics:
Average Absolute HD - average absolute value of horizontal deviation (HD) associated with real survey stations over the length of drill hole for which the THD log was created. A smaller value usually indicates better directional control performance.
Average Absolute AD - average absolute value of azimuthal deviation (AD) associated with real survey stations over the length of drill hole for which the THD log was created. A smaller value usually indicates better directional control performance.
The outer left track graphs planned and actual wellbore azimuth. Technical hole deviation in the "horizontal sense" is displayed on the two right tracks. The inner right track displays horizontal deviation (HD-blue) and the relative change in horizontal deviation (RCHD-red). The outer right track displays azimuthal deviation (AD-blue) and the relative change in azimuthal deviation (RCAD-red). A zero line (green) centers each of the two THD tracks. The actual wellbore was drilled "on depth" and "on azimuth" only when HD, RCHD, AD, and RCAD all trace their respective zero lines.
Forecasts of VD and HD profiles are shown as thick black lines that extend from the last directional survey station. THD projections are helpful for directional drillers while they rationalize directional tool setting adjustments during drilling operations.
THD well logs for three wells are presented below. These logs were created with SES and then converted to JPEG graphics files. Click a thumbnail to enlarge. All data are from actual wells.
3D Sidetrack Horizontal |
3D Sidetrack Horizontal |
2D Sidetrack Directional |
|||
3 in. / 1000 ft |
5 cm / 300 m |
1.5 in. / 1000 ft |
|||
 |
 |
 |
 |
 |
 |